In April 2021 my paper describing the genomic characterization and taxonomic placement of the red panda (Ailurus fulgens) was published in the scientific journal BMC Genomics after almost a year of review. The red panda is a unique animal, hard to classify based on its morphological characteristics. Some have classified it as a cat, some as a relative of small carnivorous animals, such as minks or weasels, yet others claim that it is a relative of the giant panda, Ailuropoda melanoleuca. Similar to the duck-billed platypus, biologists do not know where to put this animal, all the while thumbing its nose at them. Molecular characterization of this species based on small sets of genes also did not fare any better, and evolutionists contradicted one another again in further attempts to classify this animal.

It is for this reason that I employed a whole genome sequence analysis algorithm that I had developed previously analyzing three groups of insects (Anopheles, Glossina, and Drosophila)1 on 28 species of carnivores (bears, cats, martens, and one species of skunk). I did this as opposed to previous studies which looked at only handfuls of mitochondrial and/or nuclear genes. My reasoning was that if we look at the whole genome, we can get a broader picture of the genetic relatedness between species. Looks can be misleading, and since genes define physical appearance, I sought to study genomic data as opposed to morphology. To illustrate the fact that evolutionists themselves cannot make heads or furry red tails of where to place the red panda, see Table 1 below to see how various evolutionist researchers tried to classify this mysterious animal.
| Researcher(s) | Analysis | Conclusion |
| Peng et al.2 | 13 mitochondrial genes | Either mustelid or mephitid |
| Fulton and Strobeck3 | 3 nuclear and 3 mitochondrial genes | Related to Mephitis mephitis |
| Yu and Zhang4 | Introns 4 and 7 of nuclear FGB gene, ND2 mitochondrial gene | Sister to procyonids |
| Sato et al.5 | 5.5 Kbp segment containing 5 nuclear genes | Closer to mustelids or procyonids |
Table 1: Attempts by several evolutionist researchers to classify the red panda based on molecular characteristics and their conflicting results.
Perhaps this is why Panda’s Thumb took interest in my article since this animal is alleged by some to be a relative of the namesake of their website. After the paper had been published in BMC Genomics6, I adapted the results for a molecular baraminology paper, which was accepted in Creation Research Society Quarterly (CRSQ) in the fall of 20217. This meant that the secular paper had been public for over a year and a half, while the creation science paper had been available online for about a year.
Baraminology is the study of the Biblical kinds, described in Genesis 1. A kind, or using a more technical term, a ‘baramin’ is a reproductive community of organisms. Kind breeds with kind, but not with other organisms outside the kind. Humans breed only with humans, and not with chimpanzees. Horses and dogs can be bred to bring new varieties, but dogs will never interbreed with horses. An apobaramin is a group of baramins (i.e. birds, bats), whereas a monobaramin is a subset of a holobaramin (i.e. Caucasians).
Apparently, one Dr. Gerdien de Jong, an associate professor of biology at the University of Utrecht in the Netherlands, now retired, found both of my papers after a full year and wrote a critique of my work on the Panda’s Thumb titled “A tale of two papers” on December 2, 2022.8 She attacks several points in my two papers. However, she doesn’t hold back from attacking her fellow evolutionists on the editorial board of BMC Genomics, a well-respected science journal: “how did a paper as bad as this ever get through review and published?”
In the following, let us examine her approach and her criticism of my paper and whether they are well-founded, or not.
Religious bias
Note, that my BMC Genomics paper underwent several rounds of review for about a year, so the review process was thorough. Therefore, the title of my response article is “Evolutionists on Panda’s Thumb Attack Well-Respected Science Journal” just to poke some fun at my opponents.
It is remarkable that when a creation scientist writes a paper dealing with origins and it is successfully published in a secular paper, it is deemed science, and no one has any problem with it. However, once it is discovered that the same work is reinterpreted to fit the creationist framework, it is then automatically rejected as unscientific. This clearly demonstrates the religious motivation of De Jong and other evolutionists when looking at the scientific evidence and reasoning presented in my papers. Had the parallel paper not been published in CRSQ, the secular version of the paper and the folks at BMC Genomics would never have been criticized.
Interestingly, De Jong actually emailed me on December 10, 2022, eight days after her criticism of my papers went online at the Panda’s Thumb website, asking for the supplementary material of my CRSQ paper for which there was a link in my paper. She hadn’t even fully read both of my papers, yet went ahead anyway to critique them! What is this if not a foregone conclusion on her part!? De Jong obviously cannot handle the fact that other evolutionists, such as the editorial board at BMC Genomics put their stamp of approval on my work, and are now trying to level post-hoc accusations at my work, desperately trying to pick holes in it.
Evolution is not science. It is neither observable, repeatable, nor is it testable. These are all basic characteristics of science. That is why when evolutionists like De Jong find that the scientific research that has been accepted by the evolutionary biologists who took a year to review my paper can be reinterpreted to fit the creation model, they are now up in arms and trying to tear down my work. This is not the first instance of such religious bias on the part of evolutionists. When our bioinformatics research group at the University of Nebraska-Lincoln (UNL) tried to publish its work in the journal Genome Research, the journal rejected it because one of the reviewers had searched for my name on the Internet and had found out that I was a creationist. This was because a church in town had posted my presentation critical of evolution on their website. Despite the fact that the material in our paper never dealt with anything about origins. The bias on the part of evolutionists is simply that blatant.
What is science? Is baraminology science? Is evolution science?
In the blog post on the Panda’s Thumb, the regular arguments against baraminology were rehashed, yet again. However, we can know for sure that baraminology is science, whereas evolutionary theory is not. How so? Creation science studies the handiwork of God, not God’s creating hand. As a discipline within creation science, baraminology deals with species relationships that we can see. For example, members of the cat kind can visibly breed with one another. Lions can mate with tigers, pumas with leopards, to form hybrid species. However, cats cannot breed with dogs, or with bears. Baraminologists recognize and accept the clear differences between kinds, to be so great that they cannot be explained away by random mutations.
Evolutionists have a supremely difficult task since they have to explain every single biological transition between all organismal groups. If they fail one single time, then their evolutionary tree falls apart into two unbridgeable, unrelated groups. I don’t envy them!
In other words, imagine that the evolutionary tree is one large, large holobaramin, with everything in it, from bacteria to bees to birch trees and baboons. Should we break down this holobaramin into two groups with an unbridgeable gap between them, we would have some organisms (roughly half of the entire tree) that couldn’t have evolved from anything. Evolution is that flimsy. If there is a single break in the evolutionary tree, the whole theory falls apart.
Baraminologists simply take organisms at face value and recognize that there are distinct groups of species within nature that are separated from all other groups. We simply let the chips fall where they may. This is science.
Interestingly, Carl Linnaeus (1710 – 1778), “the father of modern taxonomy” believed in special creation; he lived before Darwin’s theory was formulated almost a hundred years later. Science, including the study of taxonomy, did not begin with Darwin.
On the other hand, since evolutionists believe that nature is everything, and there is no God, then all species must be interrelated, because all life evolved from non-life without any external intervention. Evolutionists are thereby forced not only to presuppose that all organisms are related to one another in the chain of evolution, but also that organisms evolved in the distant, unobservable past. This is not science.
While it is true that the exact, precise boundary of the kind is not clear, this does not discredit baraminology. Why? Neither is the definition of what a species is any clearer. Dozens of scientists have defined what a species is based on different biological aspects, such as morphology, proteomics, genetics, or ecology. Taxonomy is a science that is in constant flux. The taxonomy of fungi, for example, changes annually. Species get split up, lumped together, and reclassified on a regular basis. Evolutionists such as De Jong should first pull the beam out of their own eyes before attempting to remove the speck of dust in the baraminologists’ eyes!
So what really is the red panda?
All this being said, let us now turn to the issues that De Jong raised in her blog post criticizing my work. These critical points will be discussed one by one:
1. The red panda and the marten family (Mustelidae) are sister groups. Ailurus fulgens is not a member of Mustelidae.
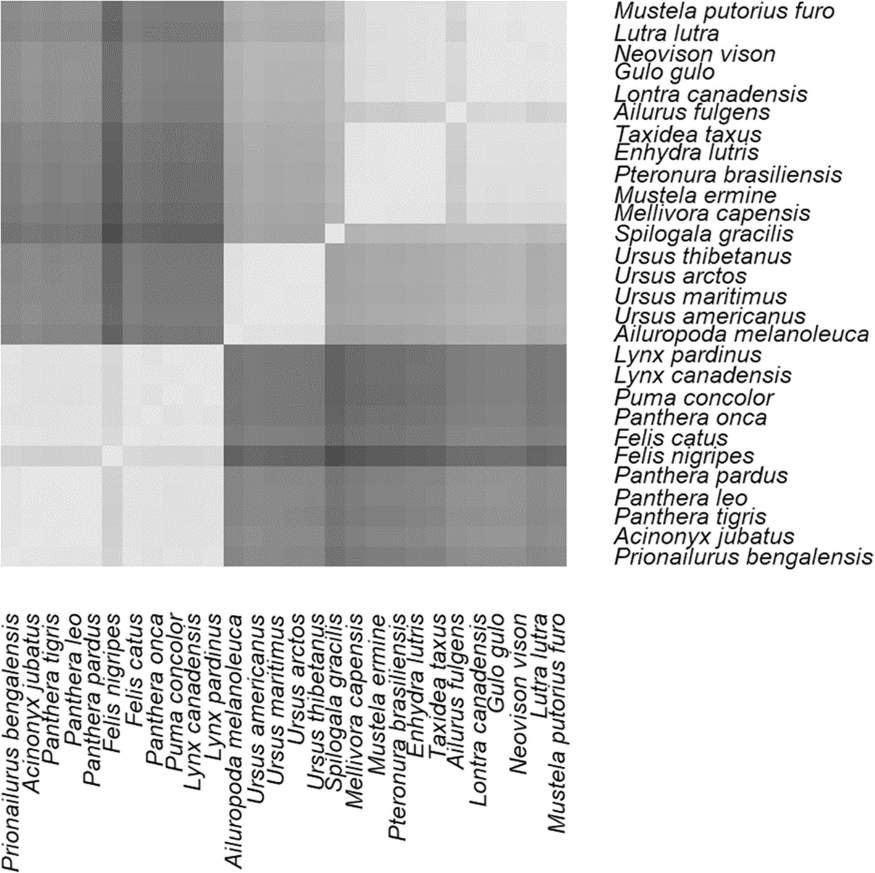
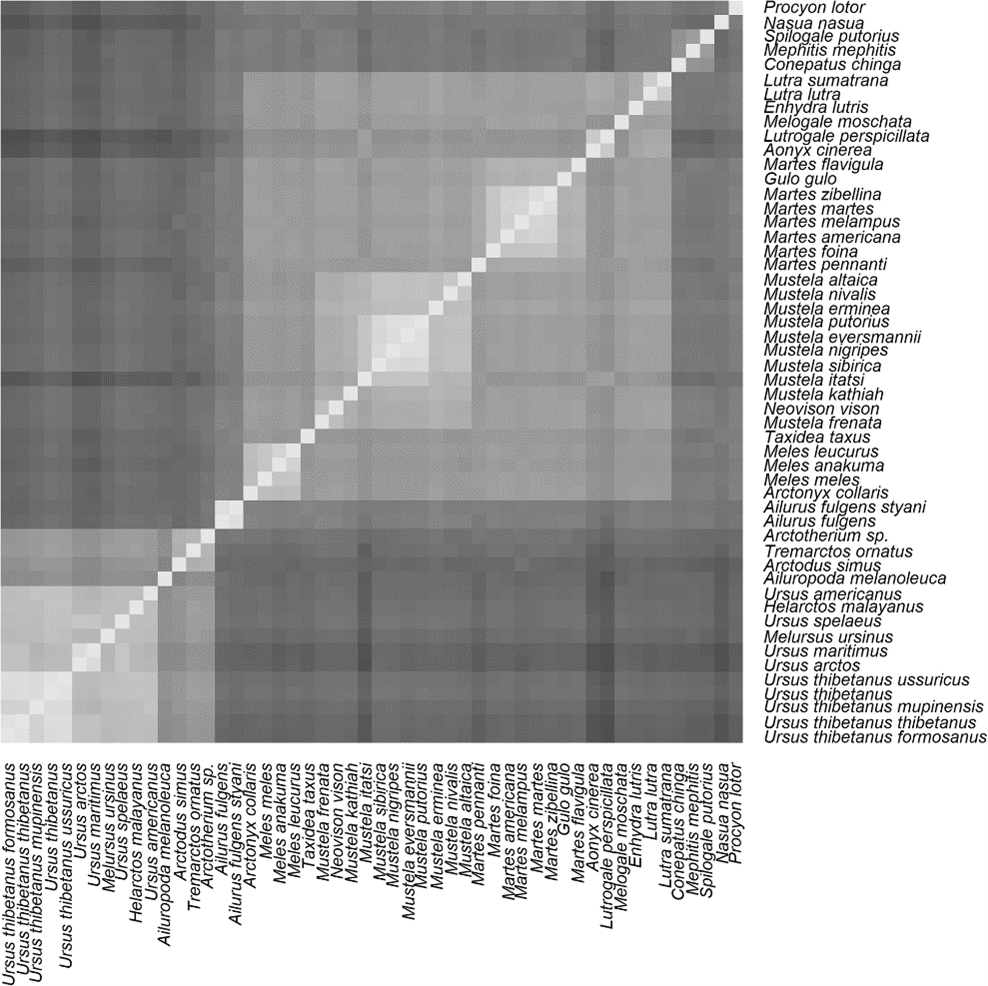
“The clustering can be regarded as evidence that the red panda and the marten family are monophyletic sister groups, but not that the red panda belongs to the marten family. The red panda has a lower mean correlation with the marten species than the mean correlation of the marten species amongst each other, showing a clear distance between panda and martens. This difference is significant (P < 1.4 x 10⁻⁶) but Cserhati writes ‘This difference is not too significant’, and he decides to ignore it. In his heat map of the correlation matrix the difference between red panda and marten species is clearly visible: left figure on top, lighter is higher correlation, and the red panda gives the top right ‘Finnish flag’ pattern.”
There are several things that should be mentioned here.9 First of all, De Jong is overplaying the distance between the red panda and the martens. It is true that the red panda has a mean correlation value of 0.89 with the mustelids, whereas the mean correlation among mustelids is 0.95±0.04. However, we have to realize that the red panda is an isolated species (it lives in the Himalayas), and thus may have diverged from all of the other mustelids, should it indeed be a mustelid. The 0.89 correlation value of the red panda is within two z-scores of the mean correlation of mustelids. Therefore, even though it is an outlier, it is not an extreme outlier.
Interestingly, De Jong either did not read the entire BMC Genomics paper, or she chose to ignore the correlation results for the black-footed cat (Felis nigripes). This species also shows a “Finnish-flag” type pattern in the lower left of figure 1 of my BMC Genomics paper (see Figure 4). The black-footed cat is a well-known, undisputed member of the family Felidae, yet, as I show in my paper, the mean correlation value of this species is also 0.89 compared to the other cats, yet the mean correlation of cats among themselves is 0.97±0.03, an even larger difference when comparing the red panda with martens, even falling outside the two z-score range. Thus, it follows that if the black-footed cat unequivocally falls within the cat family, despite larger correlation differences, it is still possible that the red panda could be a member of the marten family.
Here we have a contradiction between some statistical measurements (correlation values and a p-value), and biological reality. Note that whereas p-values may be useful in assisting scientists in making inferences, they are only guidelines, and when biological reality says otherwise, we must choose biology over statistics. Thus the p-value of 1.4 x 10^-6 does not necessarily indicate that the red panda is not a marten.
2. In the mtDNA study there is no outgroup, why was one not included?
Many phylogenetic and also baraminology studies include either outgroup species or groups to compare the group under study to a species or group of species that are known to be unrelated to the group under study. However, in this case, since, as even De Jong asserts that the groups that I used (bears, cats, and martens) follow the “traditional classification” (both according to evolution as well as creation), the use of an outgroup may be superfluous. De Jong wishes to impose her evolutionary view of classification on the species examined in this study, looking for an outlier species more basal or primitive than the species in the study. However, in baraminology, the game is played differently. I chose those groups (bears, cats, raccoons, martens, skunks) because these were the groups that most researchers claimed they were the closest to the red panda. This meant that I was trying to classify the red panda as either of these baramins, or possibly classify the red panda into its own baramin. In a sense, these various groups could be viewed as outgroups of one another.
Classifying a species into its own baramin is not without precedent. In a previous work of mine, I classified the tuatara (Sphenodon punctatus), a unique species of reptile into its own baramin10. The same might be the case here as well, there is nothing that says otherwise. In creation science, we hold to our theories loosely but we hold to Scripture tightly. The evolutionists at Panda’s Thumb also pointed out the fact that Lightner11 puts the red panda into its own baramin. However, she did not include an analysis of any mitochondrial or nuclear sequences, thus even though I respect Lightner’s work, I would rather rely on my own more detailed analysis.
3. The discordance between the mitochondrial DNA results and the genome shows that baraminology is useless.
If that is so, then all previous evolutionary attempts to classify the red panda based on molecular evidence are also worthless. These were listed in the Introduction in Table 1. These conflicting results stem from evolutionists’ usage of small gene sets to compare the red panda genome to other carnivores. It is precisely for this reason that I used the Whole Genome K-mer Signature algorithm, which compares the distribution of short k-mers between species. These k-mers are short stretches of DNA k bases long, where in my study k was set to 8 to study octamers. This is very much akin to measuring the similarity of the vocabulary of literary works. Works on architecture use different vocabulary words compared to books on fishing, which are also different from books on baking or astronomy. These literary genres correspond to the created kinds of Genesis.
Figure 2 (see figure 5 below in this article) in the BMC Genomics paper showing the result of my mitochondrial DNA analysis shows that the red panda indeed may belong to its own clade/kind. However, the mitochondrial DNA is less than a hundredth of a percent of the size of the whole genome. Not to mention basing trees on single genes, such as my analysis of cytochrome-b in the CRSQ version of the study. While it may be useful for preliminary results, analyzing the whole genome is a much more holistic approach, allowing more solid conclusions to be drawn.
Evolutionists themselves well know that phylogenies that are drawn up on the multiple alignments of individual genes often contradict one another. That is why some phylogenetic studies involve concatenating several gene sequences together to balance out these differences. My study just took this approach a step further and analyzed the whole genome sequence.
Some people (such as some of the commenters at the Panda’s Thumb) may question using a k-mer approach to analyzing DNA sequences, but this was already covered in my BMC Genomics paper. Apparently, my opponents had done a messy job reading my paper and skimmed over this. Aligning whole genome sequences with one another is a possibility, but it is not yet feasible. If short 75–200 bp Next-Generation Sequencing reads can be used to classify organisms, such as in the kraken algorithm, then why not the whole genome? The whole genome represents a much larger search space in which to measure the distribution of short signal k-mer sequences. My algorithm has also been used by other researchers in their work, such as Vanaja and Yella.12 Furthermore, other k-mer-based algorithms, such as kraken13, the Naïve Bayes Classifier (NBC)14, and PhymmBL.15
4. Baraminology is a fictional construct, and there is nothing real behind it.
According to De Jong, “Baraminology has as yet just reproduced evolutionary taxonomy: therefore, it is a waste of time. The idea that statistical clusters represent groups that are separated biologically is just a superstition.” [slightly edited for better reading]. Furthermore, “The clusters found highly depend on the input, and that is why no baraminological method represents biology.”
This is nothing of the kind, pun most definitely intended. Baraminology does not reproduce evolutionary taxonomy, I do understand where De Jong is getting this idea from. Of course, within an individual baramin species are related to one another (for example, all humans are interrelated). That is because Genesis 1:11, 12, 21, 24, and 25 declare that kinds form reproductive communities. There is continuity within a kind. But that is where relatedness all stops.
As mentioned earlier, baraminology takes observable species relationships at face value and lets the chips fall where they may, baraminologists do not religiously superimpose an evolutionary narrative that forces all kinds to be interrelated with one another when they clearly aren’t. That is why the evolutionary tree fails, and the only question is how to properly classify organisms into different kinds. Biology is messy, and mutations have accumulated ever since the Fall, so this may make things difficult. Nobody ever said science is easy, and we may need to go around several times to get the proper classification of a given species into its corresponding baramin.
De Jong references one of my previous works analyzing statistical baraminology methods16 where the BDIST algorithm (an online software that runs morphology-based baraminology analysis) was shown to find several baramins within several species of dogs. This is understandable and an artifact of using the method. Setting the taxonomic level of a baraminology analysis too low will produce meaningless results.
In one of my previous works on baraminology, we analyzed mitochondrial DNA data in humans, cats, dogs, horses, and bats, and found that dogs are a separate baramin compared to all of these other groups17.
This is why baraminologists sometimes apply a process called successive approximation. This involves a simultaneous bottom-up and top-down approach to analyzing the data. The baraminologist may try first to start with a group, which is likely to be comprised of multiple baramins (the apobaramin), such as bats, turtles, or birds. The baraminologist then drills down, trying to find individual baramins within this group. Secondly, the baraminologist may also start out from individual species or very small groups (called monobaramins), and cluster them together to find holobaramins. Where the two procedures meet is very likely to be the holobaramin. See figure 6 below:
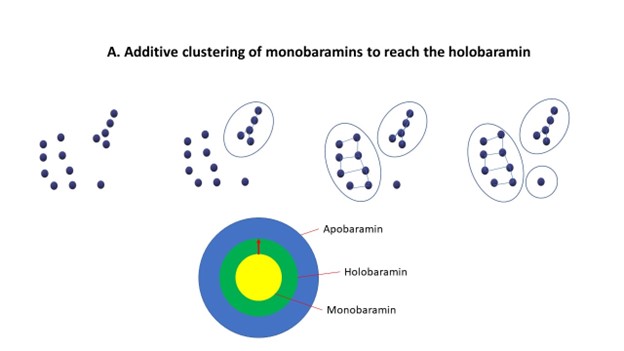
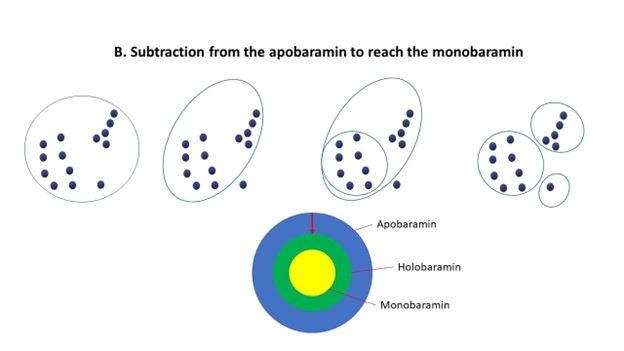
In general, when analyzing a set of species, a high degree of similarity is to be expected (be it morphological similarity, genetic relatedness or correlation values, etc.) when we are examining species from within the same baramin. However, when we compare two species from two separate baramins, there is a sharp drop in the level of similarity. This is the external surface of the holobaramin, the point where the expanding monobaramin meets the shrinking apobaramin. At this point, we should measure discontinuity between separate holobaramins. In my molecular baraminology work, this can be summed up by a statistical measure called the p-value. This measures whether within-baramin similarity values and between-baramin similarity values are statistically significant.
The fact that clustering highly depends on the input is understood. This is true for both baraminology methods and also evolution-based phylogenetic methods. For example, when constructing phylogenetic trees for different families of cell cycle genes in rice we had to build the phylogenetic tree based on a multiple alignment of proteins from a given protein family. We would then trim the ends off of the alignment in order to use the truncated part of the alignment that actually produced a strong phylogenetic signal18. Evolution in, evolution out.
Humans and chimpanzees share some traits. We have hair, fingernails, and a lengthy gestation period. This would put humans and chimpanzees into the same baramin. Humans and chimpanzees are much more complex than these three traits, and so that is why comparisons must be as holistic as possible.
Conclusion
Baraminology is science. Science did not start with Darwin and to exclude non-Darwinian models of origins is sheer arrogance. Baraminology simply accepts major discontinuity between species at face value and accepts them as they are. Evolutionists have to impose an all-encompassing tree on all of life, without ever having observed past confluence of species. Thus, it is not science.
My paper withstood a year’s worth of review in BMC Genomics and was accepted as publication-worthy science by its editorial staff. Thus, professional evolutionists state that my work is respectful science. Alas, other evolutionists, such as De Jong do not agree, not because of the science in my papers, but rather because of her evolutionary presuppositions. Thus, she feels motivated to take down something which deems a religious heresy.
De Jong apparently has a long history of blatantly trying to censor opposing viewpoints. In 2006, she criticized Dr. Maciej Giertych, a Polish population geneticist, merely for being critical of evolutionary theory in a simple eleven-sentence opinion letter to Nature in 200619.
De Jong obviously wrote her article on Panda’s Thumb without having fully reviewed my work in BMC Genomics and CRSQ. She raised several questions which had already been answered in the BMC Genomics paper. Thus, it is painfully obvious that her work is a foregone conclusion, guided by her religious presuppositions and not the actual data.
I have answered the criticisms of De Jong in this article. I applied a whole genome algorithm to genetic data from several families of carnivores to facilitate the classification of the red panda. This is an innovative approach compared to previous methods which analyzed only handfuls of genes. Based on my analysis the red panda could well belong to the family of martens. Though the red panda may be a distant member of this group, being isolated in the Himalayas, the distance is smaller compared to the black-footed cat and other cats.
Red.: For two Dutch articles on the red panda and Cserhati’s research see: https://oorsprong.info/de-lichte-steekjes-van-dr-gerdien-de-jong-op-pandas-thumb-artikel-op-oorsprong-en-onderliggende-bronnen-bekritiseerd/ and https://oorsprong.info/wetenschapper-lost-creationistisch-biosystematisch-raadsel-van-de-rode-panda-ailurus-fulgens-op/.
References
- Cserhati, M., Xiao, P., and Guda, C. K-mer based motif analysis in insect species across Anopheles, Drosophila and Glossina genera and its application to species classification. Comput Mathe Methods Med. 2019:4259479, 2019.
- Peng, R., Zeng, B., Meng, X., Yue, B., Zhang, Z., and Zou, F. The complete mitochondrial genome and phylogenetic analysis of the giant panda (Ailuropoda melanoleuca). Gene 397:76–83, 2017.
- Fulton, T.L., and Strobeck, C. Novel phylogeny of the raccoon family (Procyonidae: Carnivora) based on nuclear and mitochondrial DNA evidence. Mol Phylogenet Evol. 43:1171–7, 2017.
- Yu, L., and Zhang, Y.P. Phylogeny of the caniform carnivora: evidence from multiple genes. Genetica 127(1–3):65–79, 2006.
- Sato, J.J., Wolsan, M., Minami, S., Hosoda, T., Sinaga, M.H., and Hiyama, K. Deciphering and dating the red panda’s ancestry and early adaptive radiation of Musteloidea. Mol Phylogenet Evol. 53(3):907–22, 2009.
- Cserhati, M. A tail of two pandas- whole genome k-mer signature analysis of the red panda (Ailurus fulgens) and the Giant panda (Ailuropoda melanoleuca). BMC Genomics 22(1):228, 2021.
- Cserhati, M. Classification of the Enigmatic Red Panda (Ailurus fulgens) Based on Molecular Baraminology-Based Analysis, Creation Research Society Quarterly 58:76–84.
- https://pandasthumb.org/archives/2022/12/a-tale-of-two-papers.html.
- The figure that De Jong is referring to can be seen in figure 4 in this article below.
- Cserhati, M. Baraminic Classification of the Tuatara (Sphenodon punctatus) among Reptiles Based on Whole-Genome K-mer Signature Comparison, Creation Research Society Quarterly 57:201–206, 2021.
- Lightner, J.K. Mammalian Ark Kinds, Answers Research Journal (2012): 151–2004, 2012.
- Vanaja A., and Yella V.R. Delineation of the DNA Structural Features of Eukaryotic Core Promoter Classes. ACS Omega 7(7):5657–5669, 2022.
- Wood D.E., Salzberg S.L. Kraken: ultrafast metagenomic sequence classification using exact alignments. Genome Biol. 15(3):R46, 2014.
- Rosen G., Garbarine E., Caseiro D., Polikar R., Sokhansanj B. Metagenome fragment classification using N-mer frequency profiles. Advances in Bioinformatics 205969, 2008.
- Brady A., Salzberg S.L. Phymm and PhymmBL: metagenomic phylogenetic classification with interpolated Markov models. Nat Methods 6(9):673–6, 2009.
- Sanders, H., and Cserhati, M. Statistics, baraminology, and interpretations: a critical evaluation of current morphology-based baraminology methods. CRSQ 58(2022):175–192, 2022.
- Cserhati, M., and Carter, R.W. Hierarchical clustering complicates baraminological analysis, Journal of Creation 34(3):53–63, 2020.
- Pettkó-Szandtner A., Cserháti M., Barrôco R.M., Hariharan S., Dudits D., and Beemster G.T. Core cell cycle regulatory genes in rice and their expression profiles across the growth zone of the leaf. J Plant Res. 128(6):953–74, 2015.
- Giertych, M. Creationism, evolution: nothing has been proved. Nature 444(7117):265, 2006. De Jong G, and Korthof G. Claim of bias against critics is refuted by publication. Nature 444(7120):679, 2006.
[…] Belangrijk om te beseffen, is dat taxonomie berust op groeperen. Ik denk dat Bart Klink en Gerdien de Jong dit aspect onvoldoende beseffen als ze kritiek hebben op de manier waarop Peter Borger omgaat met baranomen. Klink zegt over Borgers baranomen: Samenvattend hebben ‘indicatorgenen’ en ‘baranomen’ geen biologische realiteit. Ze zijn circulair gedefinieerd en niet objectief vast te stellen. En de Jong zegt: Hoe identificeer je baranomen? De klassieke manier om baramins te onderscheiden is te kijken of ze kunnen kruisen – niet of ze kruisen, of tot dezelfde soort behoren, maar kunnen kruisen. Paard en ezel horen daarmee tot dezelfde baramin. Borger geeft de mogelijkheid een zygote te vormen als criterium om twee soorten tot hetzelfde baranoom te rekenen. Ook geeft hij indicator genen als een criterium om baranomen te onderscheiden. Hoe beslis je dan welk gen een indicatorgen is? Omdat het bij een specifiek baranoom hoort. Hoe weet je dat een baranoom apart geschapen is? Daar ga je van uit. Maar dezelfde kritiek treft het soortbegrip. Borger groepeert eerst (kruisen/ zygote) en daarna kijkt hij naar indicatorgenen. Datzelfde beschrijft Van Straalen ook: groeperen (soortbeschrijvingen/ diagnostische kenmerken) en objectivering: DNA-barcode. Voor een actuele discussie over groeperen, mate van verschil, keuze genetisch materiaal, etc, zie Mátyás Cserhatiin – Evolutionists on Panda’s Thumb Attack Well-Respected Science Journal. […]
[…] ontspon zich een uitgebreide discussie. Als reactie op De Jongs artikel reageerde Cserháti op de website van Fundamentum en hiernaar heb ik eerder gelinkt. Dit is de casus die voorligt. Ik had ook over de Amerikaanse das of over de hoendergans kunnen […]
[…] boom met de indeling volgens de fylogenetische boom. Dat is nogal een elementaire fout. In zijn beantwoording van De Jong gaat Cserhati op beide aspecten niet in. De Jong vat samen: Deze inleiding is […]